io_uring: The Linux I/O Revolution Most Developers Haven't Heard Of
Zero Syscalls, Shared Rings, and the End of the Context Switch Tax
Reading time: ~15 minutes
Every I/O call you've ever made has cost you two context switches. User mode to kernel mode. Kernel mode back to user mode. Your process blocks. The kernel does the work. The kernel wakes you up. For fifty years, that was the deal.
read(). write(). stat(). accept(). Every one of them: trap into the kernel, do the thing, return. Two transitions. On modern hardware with all the post-Spectre/Meltdown mitigations turned on (KPTI, retpolines, the lot), a round-trip syscall costs roughly 300-500ns. That sounds small until you're a database doing four million reads per second.
In 2019, Jens Axboe changed the deal.
The Tax You Didn't Know You Were Paying
Here's what a normal read() looks like from the CPU's perspective:
- Your code calls
read(fd, buf, count). - The C library executes a
syscallinstruction. - The CPU switches from ring 3 (user mode) to ring 0 (kernel mode). This means saving registers, switching the stack pointer, flushing parts of the TLB, touching the GDT. It's not free.
- The kernel does the actual I/O — looks up the fd, checks the page cache, maybe talks to a device driver.
- The kernel copies data into your buffer.
- The CPU switches back to ring 3. Another register save/restore, another TLB hit.
- Your code resumes.
Steps 3 and 6 are pure overhead. They don't move data. They don't compute anything. They're the cost of crossing the boundary between your process and the kernel.
One syscall? Who cares. A hundred? Still nothing. But high-throughput systems — database engines, file servers, network proxies — make millions of syscalls per second. At 200 nanoseconds each, a million syscalls cost 200 milliseconds of pure context-switch tax every second. That's 20% of a CPU core doing nothing but crossing boundaries.
I covered the event loop story in post 09: epoll solved the "which file descriptors are ready?" problem brilliantly. One syscall to wait on thousands of connections. What it didn't solve: once epoll_wait tells you fd 47 is ready to read, you still have to call read(47, buf, len). That's another syscall. For every ready fd. If 500 fds are ready, that's 500 more syscalls — 500 more round trips through the context switch gate.
epoll tells you when. You still have to do the work yourself.
The Idea: What If You Never Entered the Kernel at All?
The radical insight behind io_uring is this: what if userspace and the kernel shared a pair of ring buffers in memory, and you could submit I/O requests by writing to your side of the buffer — no syscall needed — and reap completions by reading from the kernel's side — also no syscall?
Two rings. Shared memory. mmap'd into both address spaces.
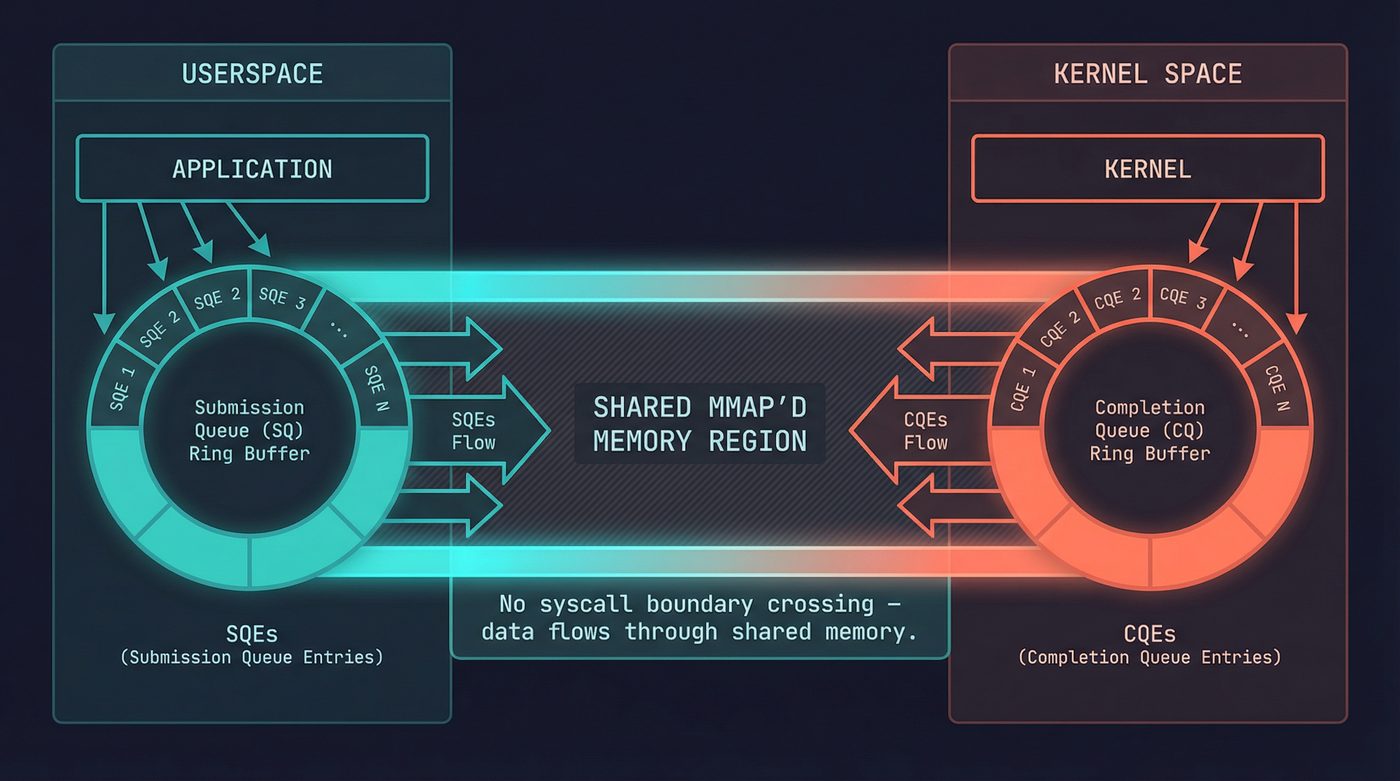
The Submission Queue (SQ) is where you put work. Each entry — an SQE — describes one I/O operation: "read 4096 bytes from fd 7 into this buffer" or "accept a connection on this socket" or "call fsync on this fd." You write the SQE into the ring, advance the tail pointer, and move on. No syscall.
The Completion Queue (CQ) is where the kernel puts results. Each CQE contains the result of one completed operation — essentially the return value you'd have gotten from the equivalent syscall. You read the head pointer, consume the CQEs, advance. No syscall.
The only syscall in the whole interface is io_uring_enter(), and its job is to tell the kernel "I've put new entries in the SQ, go process them." But even that is optional. In SQPOLL mode, the kernel runs a dedicated thread that polls the submission queue automatically. You write SQEs. The kernel picks them up. Completions appear in the CQ. Zero syscalls for the entire I/O path.
Zero.
The Ring Buffer Mechanics
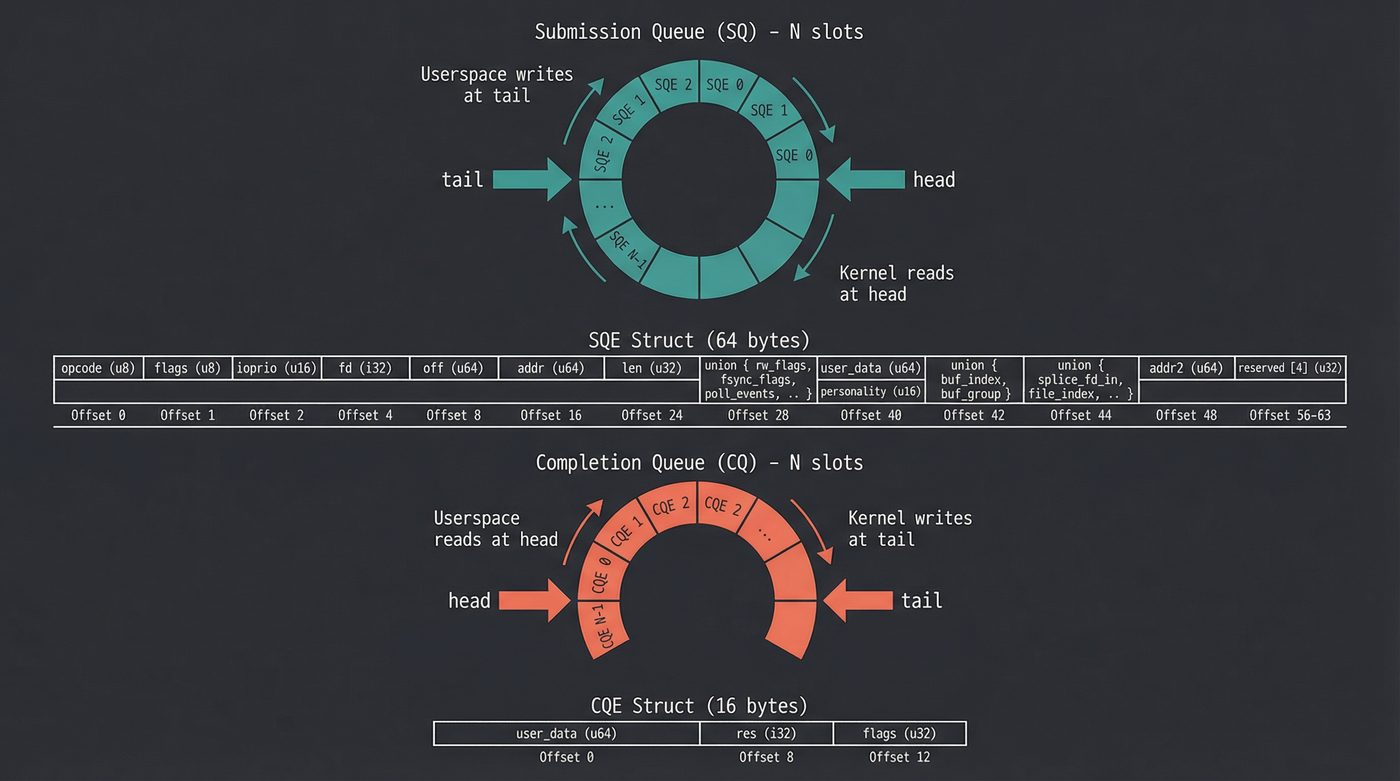
Both queues are classic lock-free ring buffers — the same pattern I covered in post 19 on synchronization primitives. Head and tail pointers. Memory barriers instead of locks. Single-producer, single-consumer on each ring.
Submission Queue:
    Producer: userspace (writes SQEs, advances tail)
    Consumer: kernel (reads SQEs, advances head)

Completion Queue:
    Producer: kernel (writes CQEs, advances tail)
    Consumer: userspace (reads CQEs, advances head)
The SQE struct is 64 bytes. It packs the opcode, the fd, the buffer pointer, the offset, flags, and a user_data field (which you get back in the CQE — it's how you match completions to submissions). The CQE is 16 bytes: the user_data and the result.
The setup call is io_uring_setup(), which returns a file descriptor and mmaps the shared regions. After that, submitting work is a memory write plus an optional syscall. In hot paths, it's a memory write and nothing else.
What io_uring Can Actually Do
When it first landed in Linux 5.1, io_uring shipped with a small but pointed set of opcodes: readv, writev, fsync, the fixed-buffer variants read_fixed and write_fixed, poll_add, poll_remove, and nop. That was 2019. Since then, it's grown into something closer to "the entire syscall interface, but async."
File I/O. Pretty much the entire filesystem syscall surface — read, write, readv, writev, fsync, fdatasync, openat, close, statx, fallocate, splice — all asynchronous.
Network I/O. accept, connect, send, recv, sendmsg, recvmsg, shutdown. Linux 6.0 added IORING_OP_SEND_ZC for zero-copy sends — the kind of feature you only care about until you suddenly care about it a lot.
Linked operations are the bit that quietly rewires how you think about syscall pipelines. You can chain SQEs into a dependency graph: "open this file, THEN read from it, THEN close it." The kernel processes them as a unit; if the open fails, the read and close are cancelled automatically; you submit the whole pipeline once and pay one round trip instead of three. I'd never seen anything else in the Linux syscall interface offer this. Once you internalise it, you start spotting round trips in your own code that you didn't know you were paying for.
Fixed files and buffers, timeouts, cancellations. Register fds and buffers with the kernel once, reference them by index in subsequent SQEs to skip per-operation lookups. Submit timeout SQEs that fire if other operations don't complete in time. Cancel pending operations by their user_data. The plumbing that production storage code actually needs.
It's a general-purpose async I/O framework disguised as a pair of ring buffers.
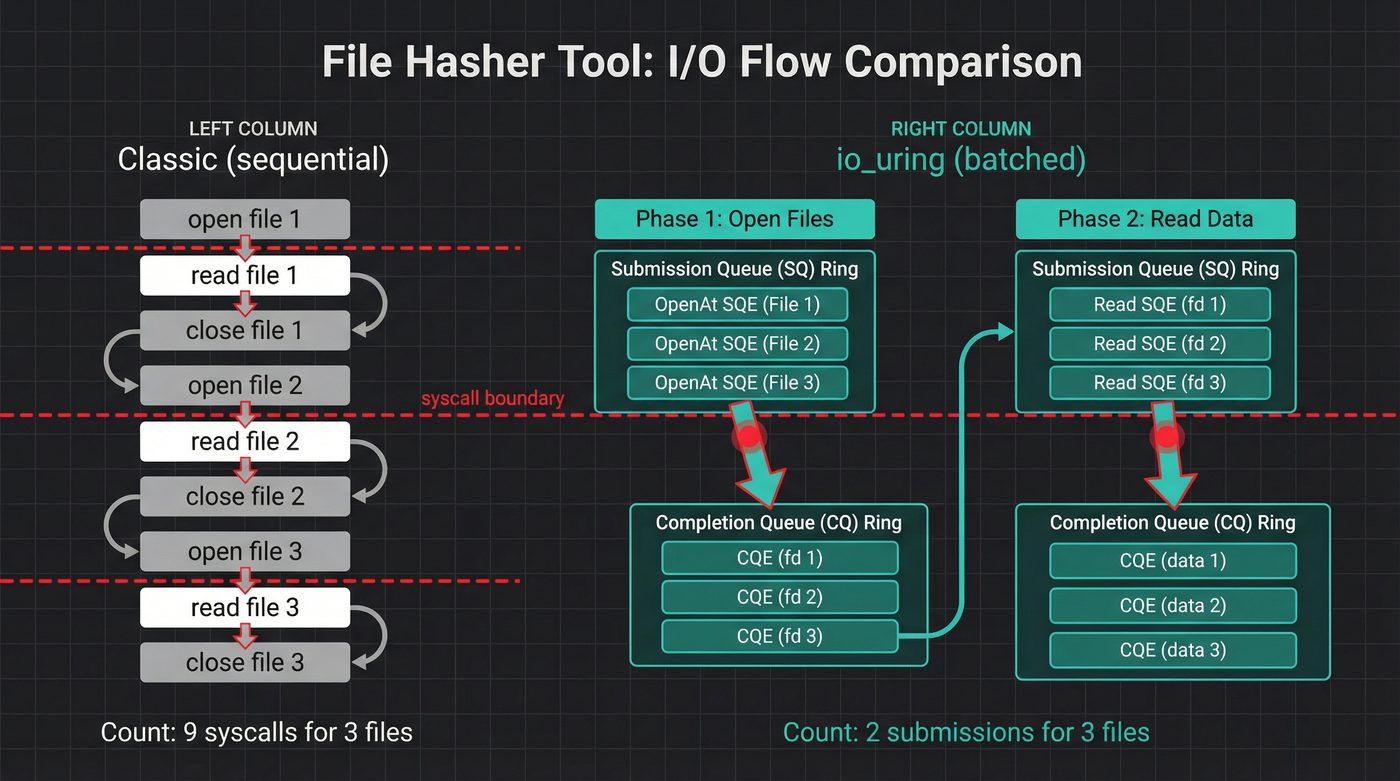
Building Something Real: A Batched File Hasher
Theory is cheap. I built a tool that hashes every file in a directory, two ways: the classic open/read/hash loop, and an io_uring version that batches the opens and reads through the ring.
The full code is in io-uring-bench on GitHub. Here are the interesting parts.
The Classic Path
Nothing fancy. Open each file, read it, feed it to SHA-256:
fn hash_classic(files: &[PathBuf], buf_size: usize) -> io::Result<HashMap<PathBuf, String>> {
    let mut results = HashMap::with_capacity(files.len());
    let mut buf = vec![0u8; buf_size];

    for path in files {
        let mut file = fs::File::open(path)?;
        let mut hasher = Sha256::new();
        loop {
            let n = file.read(&mut buf)?;
            if n == 0 { break; }
            hasher.update(&buf[..n]);
        }
        results.insert(path.clone(), format!("{:x}", hasher.finalize()));
    }
    Ok(results)
}
Every file: an open() syscall, one or more read() syscalls, a close() syscall. For 10,000 files, that's at least 30,000 syscalls.
The io_uring Path
The shape of the io_uring version is different. I submit opens in batches, reap the file descriptors, then submit reads in batches:
// Phase 1: batch-submit opens
for (i, cpath) in chunk_paths.iter().enumerate() {
    let open_e = opcode::OpenAt::new(
        types::Fd(libc::AT_FDCWD),
        cpath.as_ptr(),
    )
    .flags(libc::O_RDONLY)
    .build()
    .user_data(i as u64);

    unsafe { ring.submission().push(&open_e)?; }
}
ring.submit_and_wait(chunk_len)?;

// Reap open completions — each CQE.result() is the fd
for _ in 0..chunk_len {
    let cqe = ring.completion().next().unwrap();
    let idx = cqe.user_data() as usize;
    let fd = cqe.result(); // this IS the fd
    fds.push((idx, fd));
}
The user_data field is the glue. I set it to the file's index when I submit the SQE. When the CQE comes back, I read user_data to know which file the result belongs to. The kernel doesn't care what you put there — it's your correlation token.
Phase 2 is the same pattern: submit a batch of reads, one per opened fd, reap the completions, hash the buffers.
The full implementation handles batching (the ring has finite depth, so I chunk submissions), error cases (some opens fail), and cleanup (I close the fds the boring way — close() is cheap and batching it through io_uring would add complexity for zero gain). It's about 150 lines. Run it yourself:
git clone https://github.com/nazq/io-uring-bench
cd io-uring-bench
cargo build --release
./target/release/io-uring-bench /some/directory --mode sync --profile direct
./target/release/io-uring-bench /some/directory --mode iouring --profile direct
Both modes produce identical SHA-256 hashes. The bench.sh script tests both with warm and cold caches at 100, 1,000, and 10,000 files.
When io_uring Wins — and When It Doesn't
Here's the part where I'm supposed to show you io_uring demolishing everything. I built io-uring-bench to find out. Four strategies: synchronous read(), threaded pread(), tokio (epoll-based async), and io_uring with registered buffers and registered file descriptors — the full optimised path. I tested two workload profiles and spent a weekend being wrong before the numbers made sense.
Profile 1: Buffered sequential reads (page cache)
The obvious first test. Read files through the page cache, vary file count. ~1GB total data, warm cache, NVMe:
                    Sync        Threaded       Tokio        io_uring
10 × 100MB         10.5 GB/s   45.8 GB/s     27.6 GB/s     8.1 GB/s
100 × 10MB          9.6 GB/s   60.7 GB/s     25.8 GB/s     7.7 GB/s
1000 × 1MB          9.1 GB/s   54.0 GB/s     12.5 GB/s     6.7 GB/s
5000 × 200KB        8.3 GB/s   49.8 GB/s      4.3 GB/s     6.2 GB/s
10000 × 100KB       7.7 GB/s   52.3 GB/s      3.3 GB/s     5.9 GB/s
50000 × 10KB        3.9 GB/s   21.1 GB/s      1.1 GB/s     2.7 GB/s
io_uring loses to sync at every single row. A plain read() loop beats the ring that was supposed to replace it.
Why? Because these reads never touch the disk. The page cache serves every read() as a memcpy from kernel pages to your buffer. That memcpy takes ~8μs for a 64KB chunk. The syscall overhead to get there? About 300-500ns post-Spectre. io_uring's ring management — preparing SQEs, encoding user_data, submitting, reaping CQEs — costs somewhere in the 500-800ns range per operation in my own rough measurements. Your mileage will vary by CPU and kernel version, but the order of magnitude holds. The ring overhead is more expensive than the syscall it eliminates. When the "I/O" completes in microseconds, there's nothing to optimise.
And threaded reads at 46-61 GB/s? That's not I/O. That's multi-core memcpy across 24 threads saturating all memory channels. Tokio does the same thing with fewer threads until task-spawn overhead drowns it at high file counts.
I stared at these numbers for a while thinking the io_uring code was broken. It wasn't. I was benchmarking memory bandwidth, not I/O.
Profile 2: O_DIRECT random 4K reads (actual device I/O)
OK, so bypass the page cache entirely. O_DIRECT, 4K-aligned buffers, random offsets across a 10GB working set on ext4. io_uring with registered buffers, registered file descriptors, COOP_TASKRUN, and SINGLE_ISSUER flags. This is the workload databases actually do.
My first attempt at this test put the files on /tmp. I watched io_uring lose to pread() and spent a weekend reading papers about why. Then I ran stat -f and saw the word tmpfs. I'd been benchmarking RAM. The test files never touched the NVMe. If you've made it this far in the post, you know the feeling.
On real NVMe (ext4, O_DIRECT), 100,000 random 4K reads across 10GB. io_uring configured with IOPOLL (polled completions — the application busy-polls the NVMe completion queue directly instead of waiting for interrupts), COOP_TASKRUN, SINGLE_ISSUER, registered buffers and registered file descriptors.
IOPOLL only works if the NVMe driver has poll queues configured. I added a one-line drop-in to /etc/modprobe.d/nvme.conf:
options nvme poll_queues=16
Then I regenerated the initramfs (the nvme module loads from initramfs at boot because root is on NVMe) and rebooted. Without that step, IOPOLL silently falls back to interrupt mode and the IOPS numbers drop by an order of magnitude. Check cat /sys/module/nvme/parameters/poll_queues after reboot — if it's 0, the option didn't take.
Cold cache (echo 3 > /proc/sys/vm/drop_caches), 100K reads:
                          IOPS        Throughput    vs sync
sync pread (1 thread)     28,038      109 MiB/s     1.0×
threaded pread (1 thr)    28,290      110 MiB/s     1.0×
io_uring qd=1             31,767      124 MiB/s     1.1×
io_uring qd=4            124,158      485 MiB/s     4.4×
io_uring qd=16           426,323    1,665 MiB/s    15.2×
io_uring qd=32           738,786    2,886 MiB/s    26.3×
io_uring qd=64           941,730    3,679 MiB/s    33.6×
io_uring qd=128          981,026    3,832 MiB/s    35.0×
threaded pread (24 thr)  561,783    2,195 MiB/s    20.0×
Look at the vs sync column. io_uring at QD=128 is 35× faster than sync pread. Almost a million IOPS from a single thread. It beats 24-thread pread() by 75%.
Even at QD=1, IOPOLL gives io_uring a 13% edge over sync — the polled completion path avoids the interrupt handler entirely. But the real scaling comes from queue depth. At QD=4, you're keeping four NVMe commands in the device queue simultaneously. The drive processes them in parallel across its internal flash channels. By QD=128, the NVMe controller is saturated and you're getting everything the hardware can deliver.
This is what io_uring is for. Not replacing read(). Keeping the device queue full.
A pread() loop can only have one operation in flight at a time. The NVMe completes it in ~36μs, your thread wakes up, issues the next one, the NVMe sits idle during the syscall and context switch, starts the next read. 28K IOPS. The drive is capable of a million, but you're feeding it one request at a time through a straw.
io_uring submits 128 reads in a batch, the NVMe processes them across all its internal hardware queues simultaneously, the application busy-polls for completions without any interrupt overhead, refills the slots immediately. The device never idles. That's the difference between 109 MiB/s and 3,832 MiB/s.
The 24-thread pread() result (562K IOPS) shows the other way to solve this: throw cores at it. Each thread can have one pread in flight, so 24 threads give you QD=24 from the device's perspective. It works — 20× over sync — but you're burning 24 cores to get 57% of what io_uring achieves on one.
I hit the opposite pattern with ls-alpha in the inodes post. Batched statx via io_uring was slower than sequential stat() — because with warm inode cache, each stat completes in nanoseconds. There's no device latency to hide. io_uring wins when there's real I/O latency and you can overlap it. On page-cache hits, there's nothing to overlap.
The rule: io_uring's advantage is directly proportional to device latency × queue depth. When each I/O takes microseconds to reach the device and return, keeping dozens of them in flight simultaneously is the difference between idle hardware and saturated hardware. When I/O completes in nanoseconds (page cache), the device is never the bottleneck and the ring is pure overhead.
The Security Problem
Now the part nobody puts in the marketing slides.
io_uring is a massive kernel attack surface. The submission queue accepts dozens of operation types, each with their own parsing, validation, and execution paths. It touches file systems, networking, buffer management, and process scheduling. The kernel has to handle arbitrary combinations of linked operations, cancellations, and timeouts — all driven by data in a shared memory region that userspace controls.
The CVE list is not short. In 2022 and 2023, there were multiple privilege escalation vulnerabilities in io_uring. Use-after-free bugs. Reference counting errors. The kind of bugs that let an unprivileged user become root.
Google's response was blunt. In 2023, they disabled io_uring inside their internal sandboxed environments and ChromeOS. Their security team concluded that the attack surface was too large relative to the performance benefit for their workloads. When the people who run the largest fleet of Linux machines on the planet say "we'd rather take the syscall overhead," that's a signal worth hearing.
Docker containers block io_uring by default via the seccomp profile. If you want to use it in a container, you have to explicitly allow the io_uring_setup, io_uring_enter, and io_uring_register syscalls. Most container security guides tell you not to.
The situation is improving. Axboe and the kernel team have been hardening the code. Linux 6.1 through 6.8 landed dozens of io_uring fixes. The CVE rate is decreasing. But the fundamental tension remains: io_uring gives userspace an unusually powerful interface to kernel internals, and every powerful interface is a potential exploit vector.
My take: if you're building a database engine or a storage system where io_uring's performance matters, use it. If you're building a web application and thinking "io_uring sounds fast," use epoll. The performance difference won't matter for your workload, and the security risk isn't worth it.
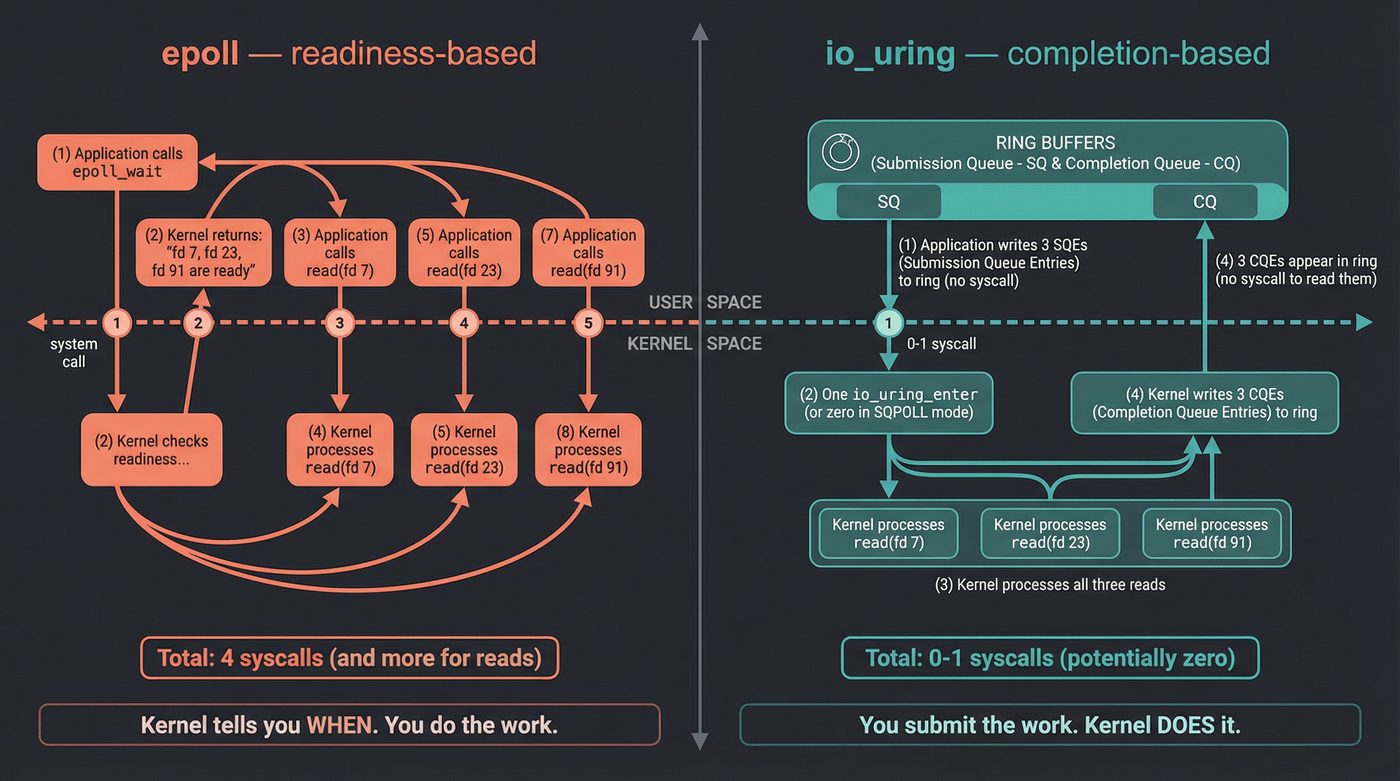
io_uring vs epoll: Readiness vs Completion
This is the conceptual jump that matters.
epoll is readiness-based. You ask the kernel: "which of these fds are ready for I/O?" The kernel says: "fds 7, 23, and 91 are ready to read." Then you call read() on each one. The kernel tells you when. You do the work.
io_uring is completion-based. You tell the kernel: "read 4096 bytes from fd 7, read 8192 bytes from fd 23, accept a connection on fd 91." The kernel does all three and tells you when they're done. You submit the work. The kernel does it.
A historical footnote that lands harder than it sounds: Windows has had completion-based I/O since 1994. I/O Completion Ports (IOCP) shipped with Windows NT 3.5 in September 1994. You submit overlapped I/O operations, and a completion port delivers the results. The Windows networking stack has been built around this model for three decades. Every high-performance Windows server — IIS, SQL Server, game servers — uses IOCP.
Linux had aio (POSIX async I/O), which was completion-based in theory but so broken in practice that nobody used it for anything serious. The implementation was limited to direct I/O (bypassing the page cache), the API was clunky, and buffered I/O fell back to synchronous execution with a thread pool — defeating the entire purpose.
io_uring is Linux finally getting completion-based I/O right. Thirty years after Windows. I'm not saying this to score points — I'm saying it because it explains why the Linux I/O ecosystem (libuv, nginx, Redis, everything) is built around readiness-based epoll, and why io_uring adoption is slower than the benchmarks would suggest. The entire stack assumes the epoll model. Switching to completion-based requires rethinking how your event loop works.
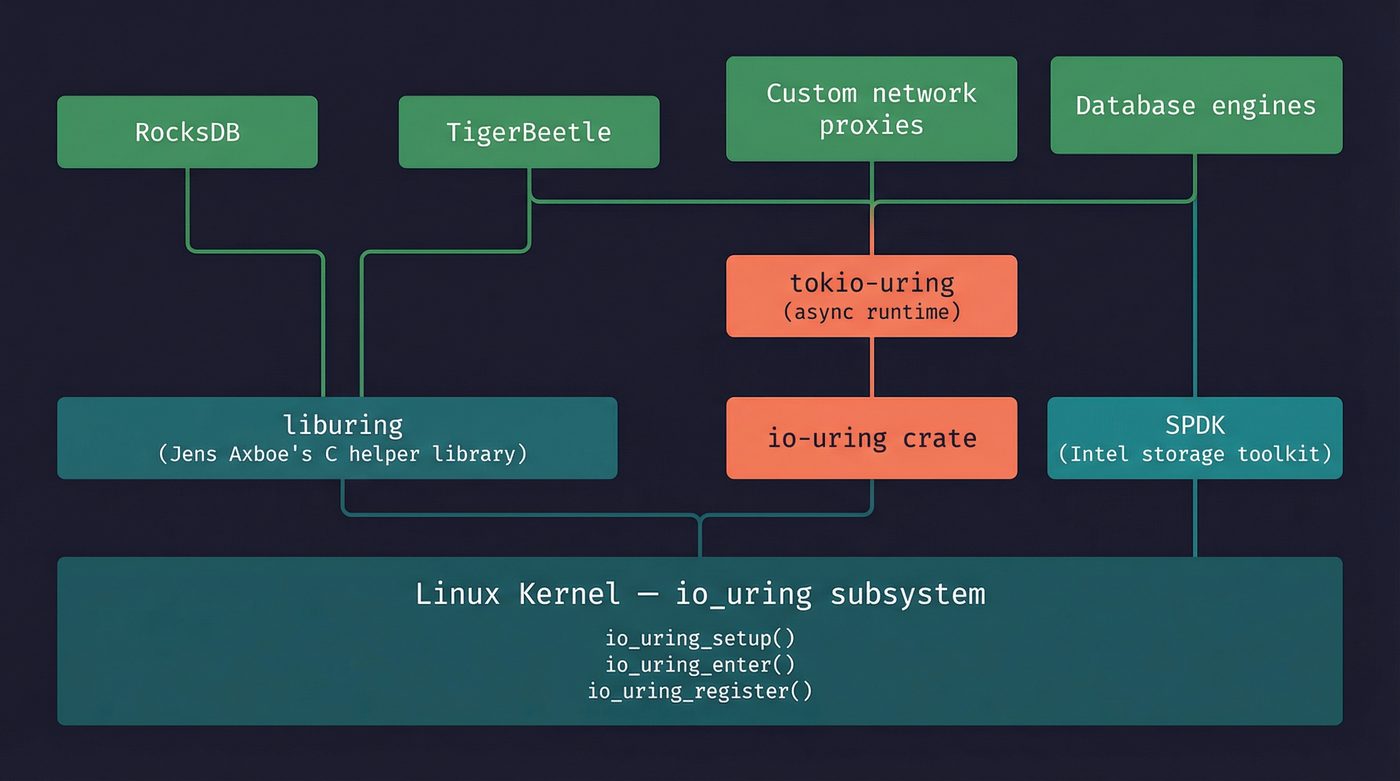
The Ecosystem
liburing (C) — Axboe's own helper library. It wraps the raw io_uring_setup / io_uring_enter syscalls with a sane API. If you're using io_uring from C, you're using liburing. github.com/axboe/liburing
io-uring crate (Rust) — a safe-ish wrapper around the raw interface. "Safe-ish" because you're still managing raw pointers to buffers that the kernel will write into asynchronously. The crate prevents the most obvious footguns but can't make the fundamental model safe without a runtime. This is what io-uring-bench uses. crates.io/crates/io-uring
tokio-uring — a Tokio runtime backed by io_uring instead of epoll. This is the ambitious one. Instead of tokio's default mio → epoll path, tokio-uring makes every .await go through the ring buffers. It's still experimental and Linux-only, which limits adoption. github.com/tokio-rs/tokio-uring
SPDK (Storage Performance Development Kit) — Intel's userspace NVMe driver framework. Uses io_uring as one of its I/O backends. When you read benchmarks claiming "19 million IOPS from a single core," SPDK plus io_uring is usually the stack. spdk.io
RocksDB — Meta's LSM-tree storage engine (underneath LevelDB, MyRocks, CockroachDB, and a dozen other databases). Added io_uring in the 6.6 release line (early 2020), initially gated behind the ROCKSDB_USE_IO_URING env var, used to parallelise MultiGet reads from a single SST file. The 6.20 release line (around April 2021) made the build default to use liburing. Compaction writes never went through io_uring. This is probably the highest-profile production user. github.com/facebook/rocksdb
The Shape of Things
io_uring is seven years old. It's proven in specific, high-throughput workloads. It's too dangerous for general sandboxed environments. It doesn't help when the I/O is already fast.
That puts it in a particular niche: systems software where you control the deployment environment and every microsecond of I/O latency matters. Database engines. Storage servers. Network proxies running on bare metal. If you're writing application code on top of a framework, your framework might adopt io_uring under the hood someday — and you'll never need to know.
But if you're the kind of developer who reads posts about what happens below the framework, now you know what's down there. Two rings. Shared memory. The kernel doing your I/O for you, without you ever asking.
The deal changed.
Further Reading
- LWN: Ringing in a new asynchronous I/O API — Jonathan Corbet's original coverage of io_uring's design, from 2019.
- Efficient I/O with io_uring (PDF) — Jens Axboe's own technical paper. The definitive reference.
- io_uring and networking in 2023 (LWN) — State of io_uring networking support and the multi-shot receive feature.
- Google's io_uring security assessment — The kCTF vulnerability research that led Google to disable io_uring.
- liburing GitHub repository — The canonical C helper library with excellent examples.
- Lord of the io_uring — unofficial guide — An accessible tutorial-style walkthrough of the io_uring API.
- man io_uring(7) — The man page. Start here for the syscall-level interface.
I'm writing a book about what makes developers irreplaceable in the age of AI. Join the early access list →
Naz Quadri once built a tool expecting io_uring to be faster than sequential syscalls, then spent an afternoon staring at benchmarks proving himself wrong. He blogs at nazquadri.dev. Rabbit holes all the way down 🐇🕳️.