Your Program Has a Housekeeper You Never Hired
Garbage Collection: From Stop-the-World to "Please, Not During the Demo"
Reading time: ~17 minutes
Your Java service just paused for 200ms. No exception. No error. No log entry. A hundred thousand objects died silently and the runtime stopped the world to clean up the bodies.
This is garbage collection. It's happening right now — in your JVM, in your Go binary, in your Python script. Every managed language on the planet pays this tax. The only question is when, how much, and whether you notice.
Imagine watching a realtime trading system pause for a few seconds in the final minute of trading before the close. In finance, that's geological time. Possible causes? A HashMap that grew to 4 million entries and got promoted to old gen, where it lived forever and forced full collections every time the heap filled up. You could have caught it in five minutes with GC logging enabled. Do you have GC logging enabled ??
The Problem: Memory Is Hard
In post 10 (malloc), I walked through what happens when you manually manage memory. You call malloc, you get a pointer, you use it, you call free. Sounds simple. It isn't.
Option one: do it yourself. Manual memory management. malloc and free. You own every byte. It gives you three ways to ruin everything:
Use-after-free. You free a block, then read from the pointer. The memory might have been reallocated to something else. Now you're reading someone else's data. Or crashing. Or — worst case — silently corrupting state and not finding out for hours.
Double-free. You free the same block twice. The allocator's internal bookkeeping gets corrupted. The next allocation might return a pointer into the middle of a live object. Chaos.
Memory leaks. You allocate and never free. Your resident set grows until the OOM killer shows up and shoots your process in the head. I've seen production services leak 50MB per hour and nobody notices for a week because the containers restart every 6 hours.
Option two: reference counting. The first attempt at automating this. Every object keeps a count of how many pointers reference it. When the count hits zero, free it. Elegant. Except for one thing: cycles. Object A points to B, B points to A. Both have a reference count of 1. Neither can be freed. Memory leaks through the cracks.
Option three: garbage collection. Let the runtime figure it out.
Mark and Sweep: The Original Algorithm
John McCarthy invented this in 1960 for Lisp. The idea is almost embarrassingly simple.
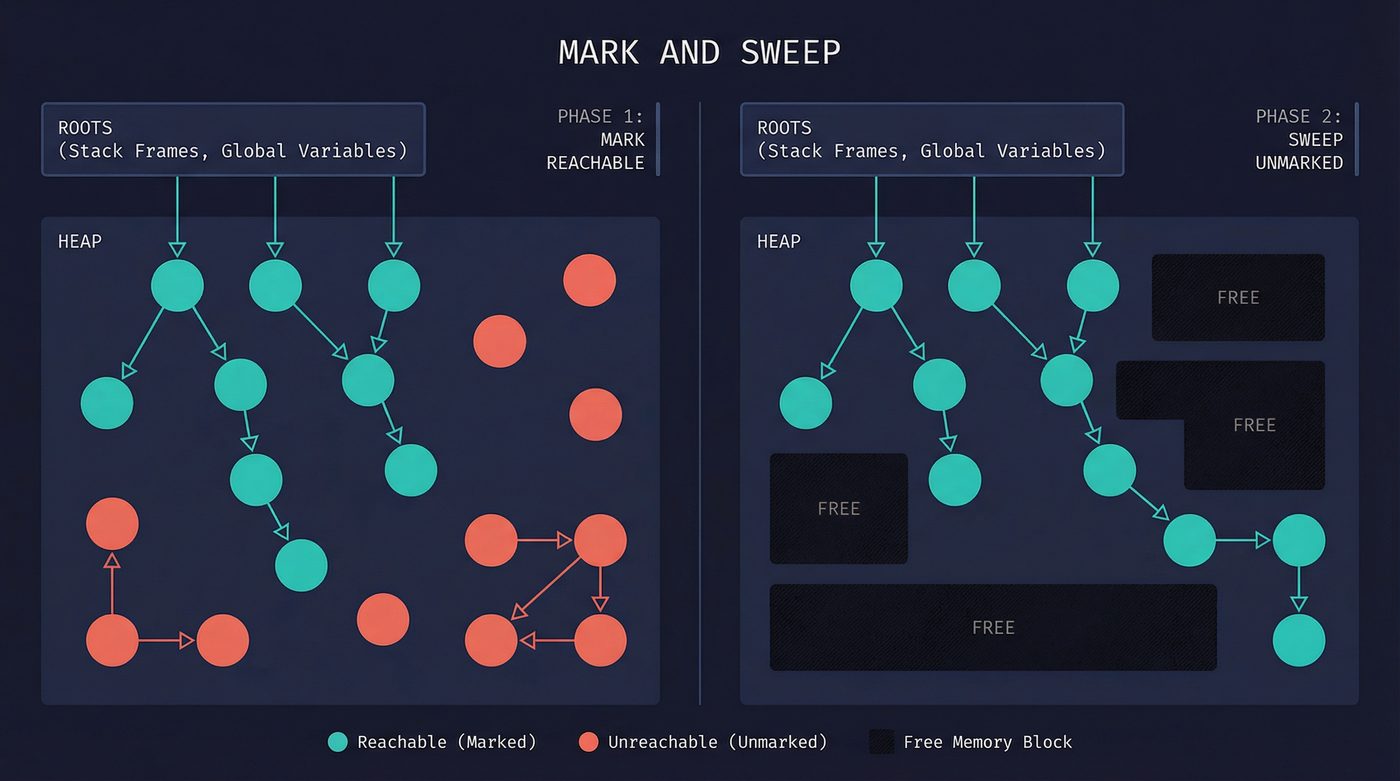
Start from the roots — the stack, global variables, CPU registers. Anything your program can reach without following a pointer through the heap. Walk every pointer you find. Mark each object you touch. When you've touched everything reachable, sweep through the entire heap and free anything that isn't marked.
That's it. Two phases. Mark. Sweep. Every object that's reachable stays. Everything else dies.
The elegance is real. The problem is also real: while the collector is walking pointers, your program can't be moving them. If your application is mutating the heap while the collector is trying to mark it, you get race conditions. The original solution was brutal — pause the entire program. Every thread. Every goroutine. Every request in flight. The collector runs alone, in silence, while your application holds its breath.
This is stop-the-world collection, and in 1960 it was fine because Lisp programs ran on single-core machines and nobody was serving HTTP traffic. In 2026, a 200ms pause means you dropped 200ms worth of requests.
The algorithmic complexity is O(live objects) for the mark phase and O(heap size) for the sweep. That distinction matters. Mark time scales with how much you're using. Sweep time scales with how much you have. A mostly-empty heap with a few live objects still has to be fully swept.
The Generational Hypothesis: Most Objects Die Young 😭
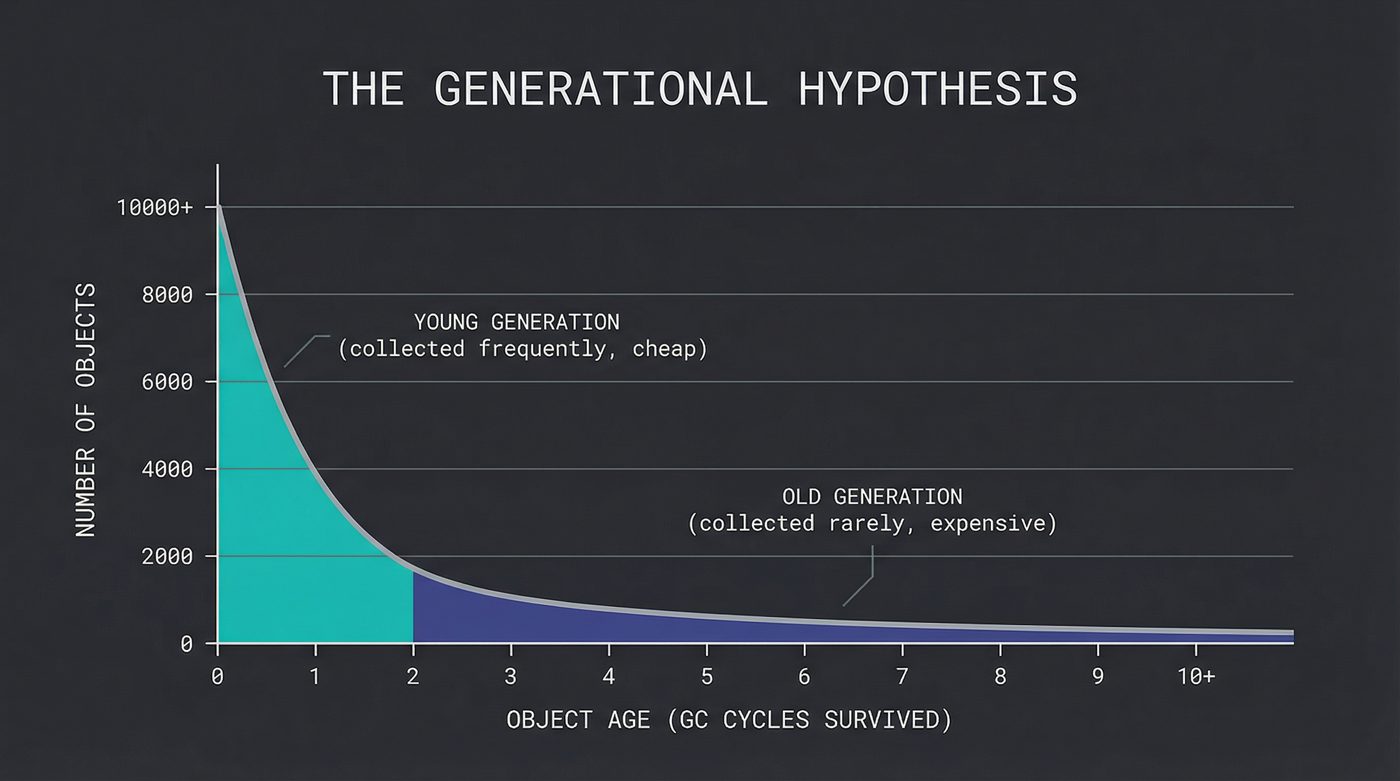
In 1984, David Ungar published a paper that changed the game. He observed something that turns out to be true across almost every program ever written: most objects die young.
That temporary string you built to format a log message? Dead within microseconds. The iterator you created to loop over a list? Dead before the loop finishes. The request object that held the HTTP headers? Dead before the response is sent.
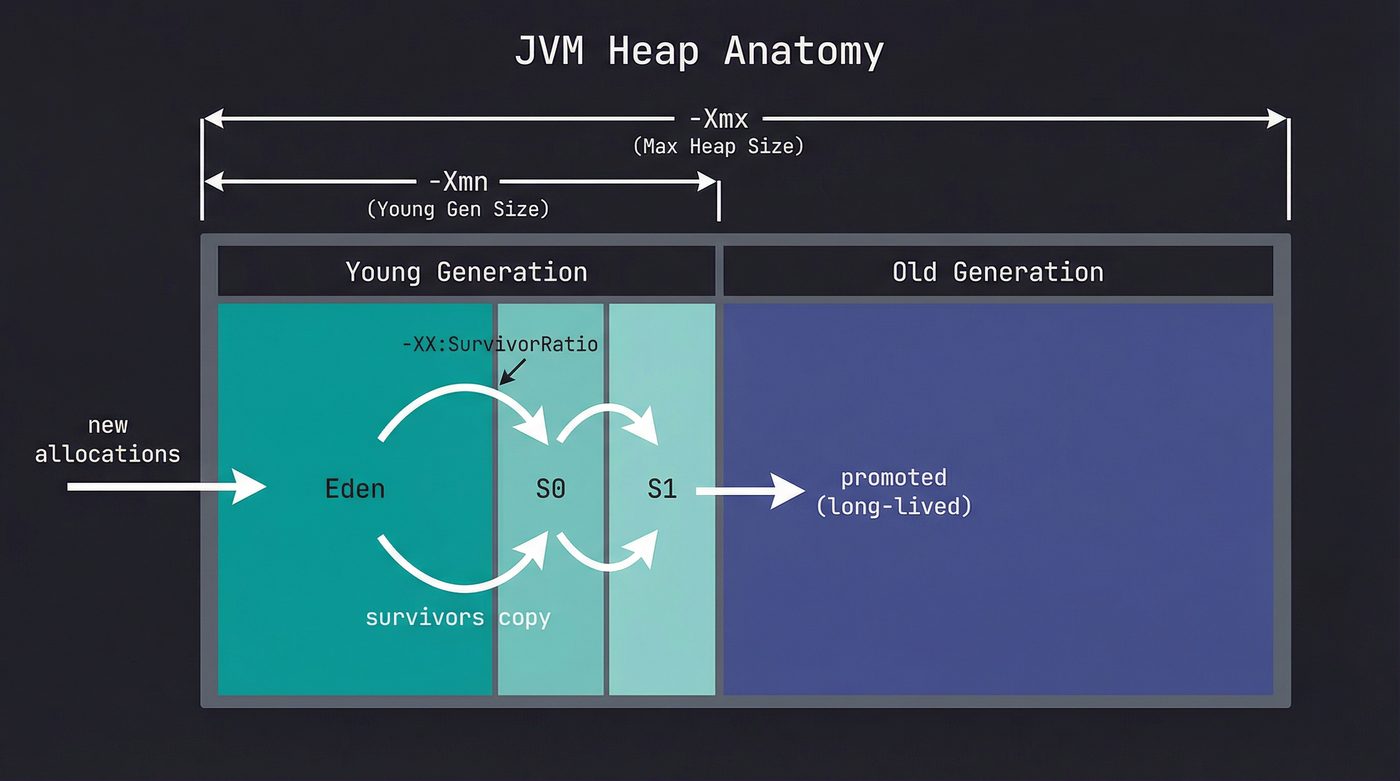
This is the generational hypothesis, and it gives you a massive optimization: split the heap into regions by age. The young generation (sometimes called the nursery or eden space) holds new allocations. The old generation (tenured space) holds objects that survived enough collections to prove they're probably going to stick around.
Collect the young generation frequently. It's small, most of it is garbage, and the collection is fast. Collect the old generation rarely. It's large, most of it is live, and the collection is expensive.
There's a catch. When you collect the young generation, you need to know if any old-generation objects point into it. If an old object references a young object, you can't collect the young object even if no young roots point to it. Tracking these cross-generational references requires a write barrier — a small piece of code that runs every time your program writes a pointer. The barrier checks: "did I just store a pointer from old space into young space?" If yes, it records that reference in a remembered set so the young-generation collector knows to treat it as a root.
Write barriers aren't free. Every pointer store gets slightly more expensive. But the trade-off is worth it: young-generation collections in a well-tuned JVM take single-digit milliseconds.
Java's GC Landscape: A Museum of Tradeoffs
Java has been collecting garbage for 30 years. In that time, it has accumulated more garbage collectors than some languages have keywords. This isn't indecision — it's a reflection of the fact that there is no single correct answer.
Serial GC. One thread, stop-the-world. The original. Still useful for small heaps or containers with a single vCPU. Don't laugh — if your Lambda function has 256MB of heap and one core, Serial is the right call.
Parallel GC. Serial with more threads. Default before Java 9. Still the right answer for batch jobs nobody is watching.
G1 (Garbage First). In the aftermath of the GFC, in May 2009, Java 6 Update 14 dropped what felt like a gift from the Java gods. A new collector, switched on with -XX:+UnlockExperimentalVMOptions -XX:+UseG1GC — a flag combo that became muscle memory for every Java dev who lived through the transition. G1 went GA in Java 7, default in Java 9, at which point the experimental flag stopped being needed. But it lived on in those hard to kill bootstrap scripts. G1 splits the heap into equal-sized regions instead of two contiguous generations. Collects the regions with the most garbage first (hence the name). Targets a configurable pause time — you say "I want pauses under 200ms" and G1 tries to comply. Doesn't always succeed, but it's remarkably good at it.
I'm skipping CMS (Concurrent Mark-Sweep) because Oracle deprecated it in Java 9 and removed it in Java 14. If you're still running CMS, you have bigger problems than GC pauses.
ZGC and Shenandoah. The new generation. Both are concurrent collectors that aim for sub-millisecond pauses regardless of heap size. ZGC uses colored pointers — it steals bits from the 64-bit pointer to encode GC metadata directly in the address. Shenandoah uses Brooks forwarding pointers. But can we take a moment to appreciate it has the greatest name of anything in the entire Java ecosystem. Both can handle multi-terabyte heaps with pauses under a millisecond. The catch? Slightly lower throughput than Parallel or G1 because the concurrent work isn't free. The CPU cycles don't vanish — they get spread across your application threads instead of concentrated in a pause.
The throughput-vs-latency tradeoff is the fundamental tension. You can maximize total work done (throughput) or minimize worst-case pause (latency). You cannot maximize both. This is why Java has six collectors. Different workloads sit at different points on that curve.
Go's GC: The Road Not Taken
Go made a controversial choice: no generational collection.
Go went a different direction from day one: no generations, concurrent collection, and simplicity over cleverness. In Go 1.5 (2015), that collector went fully concurrent — pauses dropped from hundreds of milliseconds to sub-millisecond — and the design choice started to look less strange. The pitch was essentially "we can get good-enough pauses with a concurrent, non-generational collector, and the implementation will be simpler." That wasn't a popular opinion in 2015. It's still not universally popular. But the results have been surprisingly good.
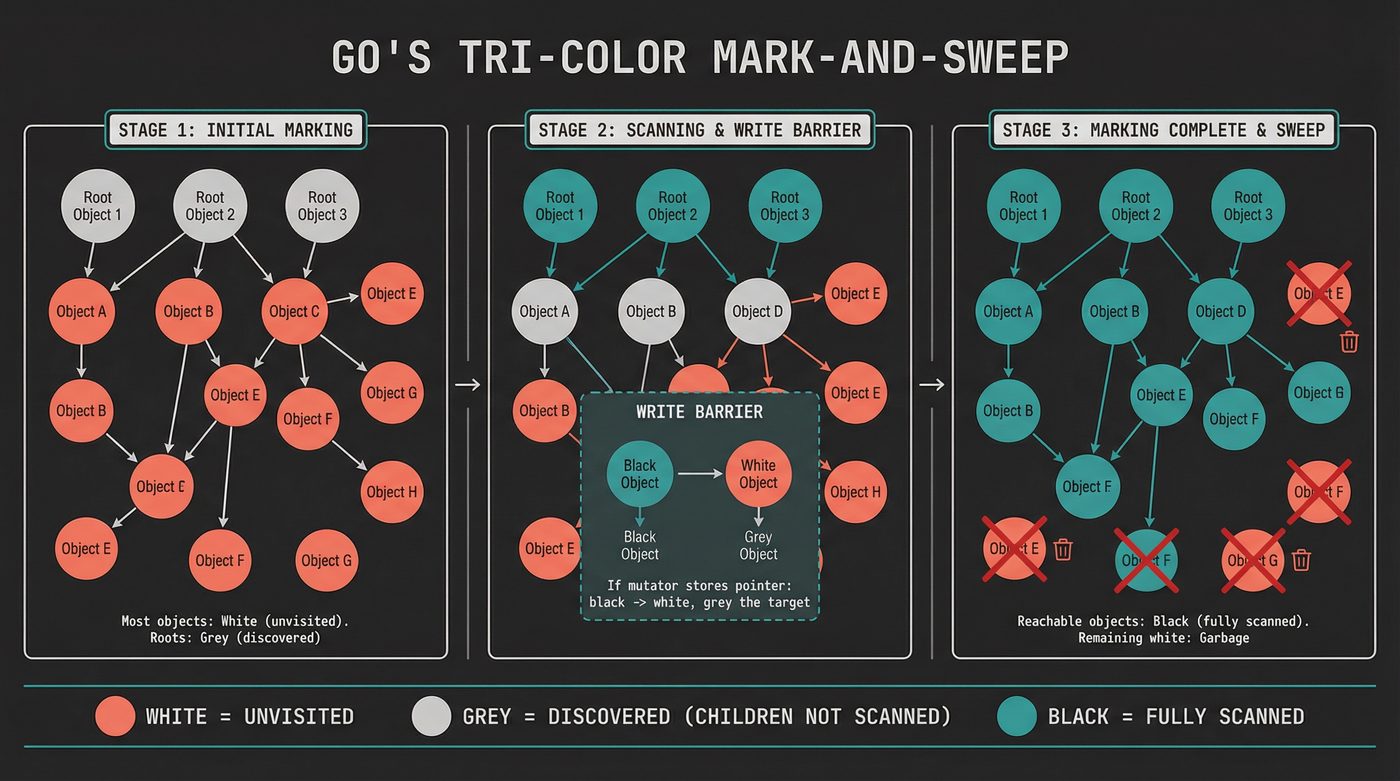
Go uses a tri-color mark-and-sweep algorithm. Objects are white (unvisited), grey (visited but children not yet scanned), or black (visited and children scanned). The collector starts by greying the roots, then repeatedly picks a grey object, scans its children (greying them), and blackens it. When no grey objects remain, everything still white is garbage.
The key insight: this runs concurrently with your program. The mutator (your application code) and the collector run on different goroutines at the same time. To maintain correctness, Go uses a write barrier that ensures the collector never misses a live object. The invariant is: a black object can never point directly to a white object. If your code stores a pointer from a black object to a white object, the write barrier greys the target.
Go's collector targets spending no more than 25% of CPU on garbage collection. The GOGC environment variable controls the ratio of new allocations to live heap that triggers a collection — the default of 100 means "collect when the heap has doubled since the last collection."
The tradeoff is throughput. Go's GC does more total work than a generational collector would because it scans the entire heap every time. For most Go services — which tend to have modest heaps and are throughput-limited by I/O, not CPU — this doesn't matter. For CPU-bound programs with large heaps, it stings. The Go team has been iterating on this since 1.5, and the pauses have dropped from tens of milliseconds to sub-millisecond in most cases. On allocation-heavy CPU-bound workloads with big heaps, a well-tuned Java G1 or ZGC can beat Go on raw throughput, but the gap narrows as the workload profile shifts — it's genuinely a "depends on your shape" comparison, not a clean "Java wins."
I find Go's approach philosophically interesting. They chose clarity over cleverness. One collector. One tuning knob (GOGC). No generation ratios, no region sizes, no pause-time targets. Anyone who's spent any time tuning the JVM knows what I'm talking about. It's the Unix philosophy applied to garbage collection — do one thing, make it simple, let the user compose. Ken Thompson co-created Unix and co-designed Go. The through-line isn't accidental.
Python's GC: Belt and Suspenders
Python (specifically CPython) does something weird: it uses reference counting as the primary mechanism and has a tracing garbage collector as backup.
Every CPython object has a reference count field. When you assign x = obj, the count goes up. When x goes out of scope, the count goes down. When it hits zero, the object is freed immediately. No waiting for a collection cycle. No pause. The memory is back in the pool the instant nobody is looking at it.
This is why CPython's memory behavior feels responsive. Allocate a million objects in a loop, and they're freed as you go. In Java, they'd pile up until the next GC cycle.
But reference counting can't handle cycles. And Python creates cycles all the time — a class instance that holds a reference to its class, which holds references to its instances through __dict__. Every exception creates a cycle through the traceback. So CPython has a cycle detector that runs periodically to find and break reference groups where every object in the group is only referenced by other objects in the group.
The cycle detector uses a generational scheme (three generations, collected at different frequencies), but the reference counting does the heavy lifting. In practice, the cycle detector rarely has much work to do.
This has deep implications for the GIL discussion from post 11. Reference counts must be updated atomically in a multithreaded environment. Without the GIL, every x = obj would need an atomic increment, and every scope exit would need an atomic decrement. Atomic operations are not free — they require cache-line synchronization across cores. The GIL avoids this by ensuring only one thread runs Python bytecode at a time, which means reference count updates don't need to be atomic. Removing the GIL (which Python 3.13 is experimenting with — you opt in at build time by compiling with --disable-gil, which gives you a python3.13t binary, then control it at runtime via the PYTHON_GIL environment variable) means solving the reference counting concurrency problem. The free-threading PEP uses biased reference counting, where each object is "owned" by a thread that can update the count cheaply, with cross-thread updates going through a slower path. Clever, but not free.
Rust's Approach: The Compiler Is the Collector
Rust doesn't have a garbage collector. It doesn't have reference counting (by default). It doesn't have manual malloc/free.
Instead, it has the borrow checker — a compile-time system that tracks ownership and lifetimes of every value in your program. Every value has exactly one owner. When the owner goes out of scope, the value is dropped. No runtime cost. No pauses. No write barriers.
fn process() {
    let data = vec![1, 2, 3];  // data is allocated on the heap
    do_something(&data);        // borrowed — not moved
}   // data is dropped here. deterministic. zero cost.
void process() {
    var data = List.of(1, 2, 3);  // allocated on the heap
    doSomething(data);             // reference passed
}   // data is now garbage. freed... eventually. maybe.
The borrow checker is the garbage collector. It runs at compile time instead of runtime. The genius is that it proves at compile time what GC discovers at runtime: which objects are reachable and when they stop being reachable.
The pain is also real. The borrow checker rejects programs that are correct but can't be proven correct within its type system. You end up fighting it on linked lists, self-referential structs, and graph data structures. The unsafe keyword exists for a reason. Rc<T> and Arc<T> exist for a reason — sometimes you genuinely need reference counting, and Rust lets you opt into it explicitly rather than paying for it everywhere.
I think this is the most important insight in systems programming of the last 20 years: the garbage collection problem is really a proof problem. If you can prove at compile time that a value is unreachable, you don't need runtime collection. Rust proved it's possible. Yes, it's true, mathematicians' lives matter. The trade-off is developer velocity — the borrow checker is the reason Rust has a steeper learning curve than Go.
I personally prefer the Rust approach. Do I want to feel pain now, at my desk, in a calm problem-solving mindset while I battle the fire-breathing borrow checker? Or at 3am, bleary-eyed, trying to remember how cool_loop_w_odd_allocation_behaviour.py works while servers are on fire and business users are asking if there's an update or ETA yet 😤? I'll take the compiler yelling at me every time, at least it speaks my language.
The GC Pause Problem
Let me be concrete about why GC pauses matter.
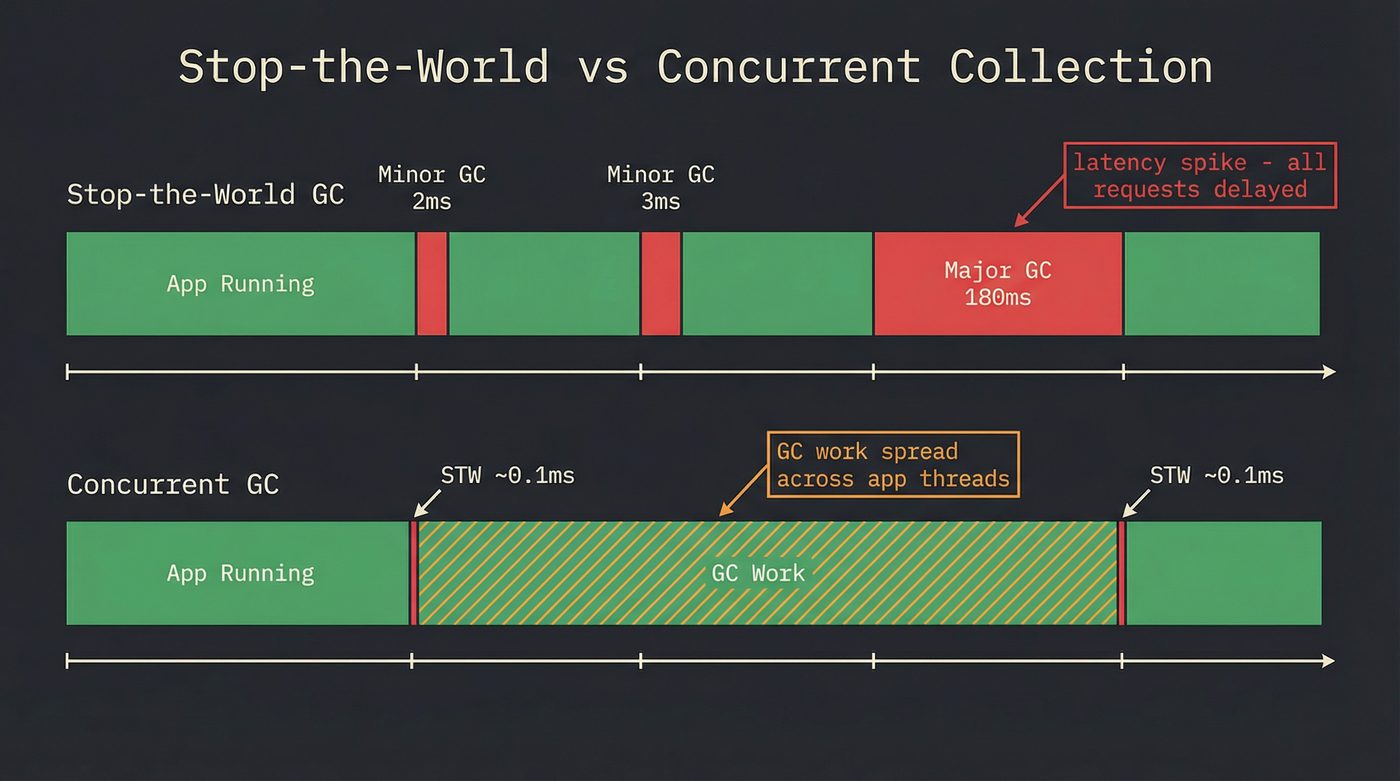
Your service handles requests with a median latency of 4ms. Your p99 is 8ms. Your SLA says p99.9 must be under 50ms. Then a major GC pause hits — 180ms. Every request in flight during that pause gets delayed by 180ms. Your p99.9 just blew through the ceiling. Not because your code was slow. Not because the database was slow. Because the runtime decided to clean house.
This is the latency tail problem, and it's why low-latency systems care so much about GC. The median doesn't matter. The worst case matters.
Concurrent collectors (ZGC, Shenandoah, Go's collector) address this by doing most of the work while your application runs. They still need short stop-the-world pauses — typically to scan the stack roots and flip some internal state — but these pauses are microseconds, not milliseconds. The GC work that used to happen in a 180ms pause now happens across 180ms of CPU time spread over your application threads. Total work done is roughly the same (or slightly more, because of the write barrier overhead). But no single request sees the full 180ms hit.
Escape Analysis: The Best GC Is No GC
Here's something most developers don't know: the JVM's JIT compiler actively tries to avoid heap allocation.
When the JIT can prove that an object never "escapes" the method that created it — never gets stored in a field, never gets passed to a method that might store it, never gets returned — it can allocate the object on the stack instead of the heap. Stack allocation is free in the same way local variables are free: the memory is reclaimed automatically when the method returns. No GC involved.
// The JIT might allocate this Point on the stack
Point p = new Point(x, y);
double dist = Math.sqrt(p.x * p.x + p.y * p.y);
// p never escapes — no heap allocation needed
// Go's compiler does escape analysis at compile time
p := &Point{X: x, Y: y}
// If p doesn't escape, it stays on the stack
dist := math.Sqrt(p.X*p.X + p.Y*p.Y)
This is escape analysis, and the JIT does it aggressively. In hot loops, it can eliminate the majority of allocations. Go's compiler does the same thing at compile time rather than at JIT time — run go build -gcflags='-m' to see the escape analysis decisions.
The practical implication: if your program allocates a lot of short-lived objects in hot loops, the JIT might already be fixing it for you. But if those objects escape — say, because you pass them to a logging framework or stuff them in a concurrent queue — they end up on the heap and become GC's problem.
"If you're tuning GC, you probably have an allocation problem." If I had a dollar for every time I've said this... The right fix is almost never changing GC settings. It's reducing the number of objects you allocate in the first place, or restructuring your code so they don't escape the stack.
The Dark Corners: Finalizers and Weak References
Finalizers are wrong. I'm not hedging. They're almost always wrong.
A finalizer is a method that runs when an object is about to be collected. Java's finalize(), Python's __del__, Go's runtime.SetFinalizer. The idea is: clean up resources (file handles, sockets, native memory) when the object dies.
The problems cascade. Finalizers run at unpredictable times. An object with a finalizer can't be collected in the same cycle it becomes unreachable — the runtime has to call the finalizer first, which means the object survives an extra GC cycle (getting promoted to old gen, making everything worse). In Java, a finalizer can resurrect an object by storing this somewhere reachable. The finalizer thread is single-threaded and low-priority, so if finalizers are slow, they back up and your heap fills with undead objects waiting for their funeral.
Use try-with-resources in Java. Use with statements in Python. Use defer in Go. Use Drop in Rust. Deterministic cleanup beats finalizers every time.
Weak references are a different story. A weak reference points to an object but doesn't prevent it from being collected. Java's WeakHashMap uses this for caches: the entries stay as long as the key objects are alive, then vanish when the keys are collected. It's how you build a cache that can't cause a memory leak. But be careful — in generational collectors, weak reference processing can be surprisingly expensive because clearing them requires coordination across generations.
GC Tuning: The Last Resort
When you do need to tune — and sometimes you do — here's what matters.
Heap size. Bigger heap means less frequent collections but longer pauses when they happen. Smaller heap means more frequent collections but shorter pauses. The sweet spot depends on your allocation rate and your latency requirements. Start with -Xmx equal to 3-4x your live data set and adjust from there.
Generation ratios. -Xmn controls the young generation size. Too small, and objects get promoted to old gen before they have a chance to die. Too large, and young-gen collections take longer. The default is usually fine. If it's not, your allocation pattern is unusual and you should understand why before turning knobs.
GC logging. Turn it on. Always. -Xlog:gc* in modern Java. The logs tell you exactly when collections happen, how long they take, how much they freed, and whether objects are being promoted prematurely. I have never once regretted enabling GC logging. I have regretted not enabling it approximately fifty times.
For Go, the equivalent is GODEBUG=gctrace=1. For Python, gc.set_debug(gc.DEBUG_STATS).
But I meant what I said earlier. If you're tuning GC parameters, step back and ask: why am I allocating so much? Can I reuse objects? Can I use value types instead of heap-allocated objects? Can I restructure the hot path to avoid escaping allocations? The cheapest object to collect is the one you never created.
The heap layout also affects cache performance, which I covered in post 15 (RAM). GC-managed heaps tend to fragment over time, scattering related objects across memory. Compacting collectors (G1, ZGC) fight this by copying live objects into contiguous regions, which improves cache locality at the cost of the copy overhead. Non-compacting collectors (Go's) accept fragmentation and rely on the allocator to manage free lists efficiently.
Further Reading
- malloc Is Not Free — The manual memory management alternative. What happens when there's no GC to save you.
- How Your Python Code Actually Runs — CPython's runtime, the GIL, and why reference counting matters.
- The Garbage Collection Handbook — Jones, Hosking, and Moss. The definitive reference. If you want to understand any collector at the algorithm level, start here.
- A Guide to the Go Garbage Collector — The Go team's own explanation of their collector, GOGC, and the soft memory limit.
- Java GC Tuning Guide (JDK 21) — Oracle's official guide. Covers G1, ZGC, and the tuning flags that actually matter.
I'm writing a book about what makes developers irreplaceable in the age of AI. Join the early access list →
Naz Quadri once spent a weekend reading JVM GC logs in a Grafana dashboard like it was a thriller novel — protagonist survives minor collection, gets promoted to old gen, faces a full GC, flatlines at finalization. He blogs at nazquadri.dev. Rabbit holes all the way down 🐇🕳️.